SRTM Path Profile: A Practical Walkthrough
Understanding terrain between two radio sites is essential for microwave path planning. Whether you’re checking out a new hilltop for line‑of‑sight paths to potential QSO partners, estimating path losses to see if you stand a chance of working someone, or simply visualising the ground between two points, Mike Willis’s SRTM Path Profile utility is one of the most useful tools available. It uses freely available Shuttle Radar Topography Mission (SRTM) data to generate accurate terrain profiles — ideal for microwave enthusiasts and other RF experimenters.
After helping a few people set up the software, I decided to write this short guide to walk you through installing it, obtaining the correct terrain tiles, and getting everything running smoothly.
What the Software Does
The SRTM Path Profile tool reads SRTM .HGT terrain data and produces a height profile between two coordinates. It can export profiles for use in other prediction tools and includes a propagation model based on ITU‑R recommendations. The terrain data is available at 1‑arcsecond (~30 m) and 3‑arcsecond (~90 m) resolution depending on the tiles you use.
For most amateur radio applications — especially in the UK — the 1‑arcsecond tiles from Viewfinderpanoramas provide excellent detail and are easy to work with.
Installation & Setup
Here is a step‑by‑step guide to installing the software.
1
Download the SRTM Path Profile Software
Get the latest version of Mike Willis’s terrain profiling utility.
2
Download the Correct Terrain Tiles
Important: The program requires 1‑arcsecond SRTM tiles from Viewfinderpanoramas.
3
Unzip the Terrain Tiles
The software can only read tiles when they are placed in the same directory.
- The software can only read tiles when they are placed in the same directory.
- Unzip each downloaded tile
- Place the .HGT files directly into the same folder as the SRTMPathProfile program
- Do not store them in subfolders — the program expects them alongside the executable
4
Launch the SRTM Path Profile Program
On first run, the software will ask where the terrain data is located.
- Open SRTMPathProfile.exe
- When prompted, browse to the folder containing your .HGT files
- Select any tile — the program will automatically index the rest
5
Verify Everything Works
Once the tiles are loaded, the program is ready to generate terrain profiles.
- Enter the two sets of coordinates (e.g., locator grids for TX and RX)
- Generate the path profile
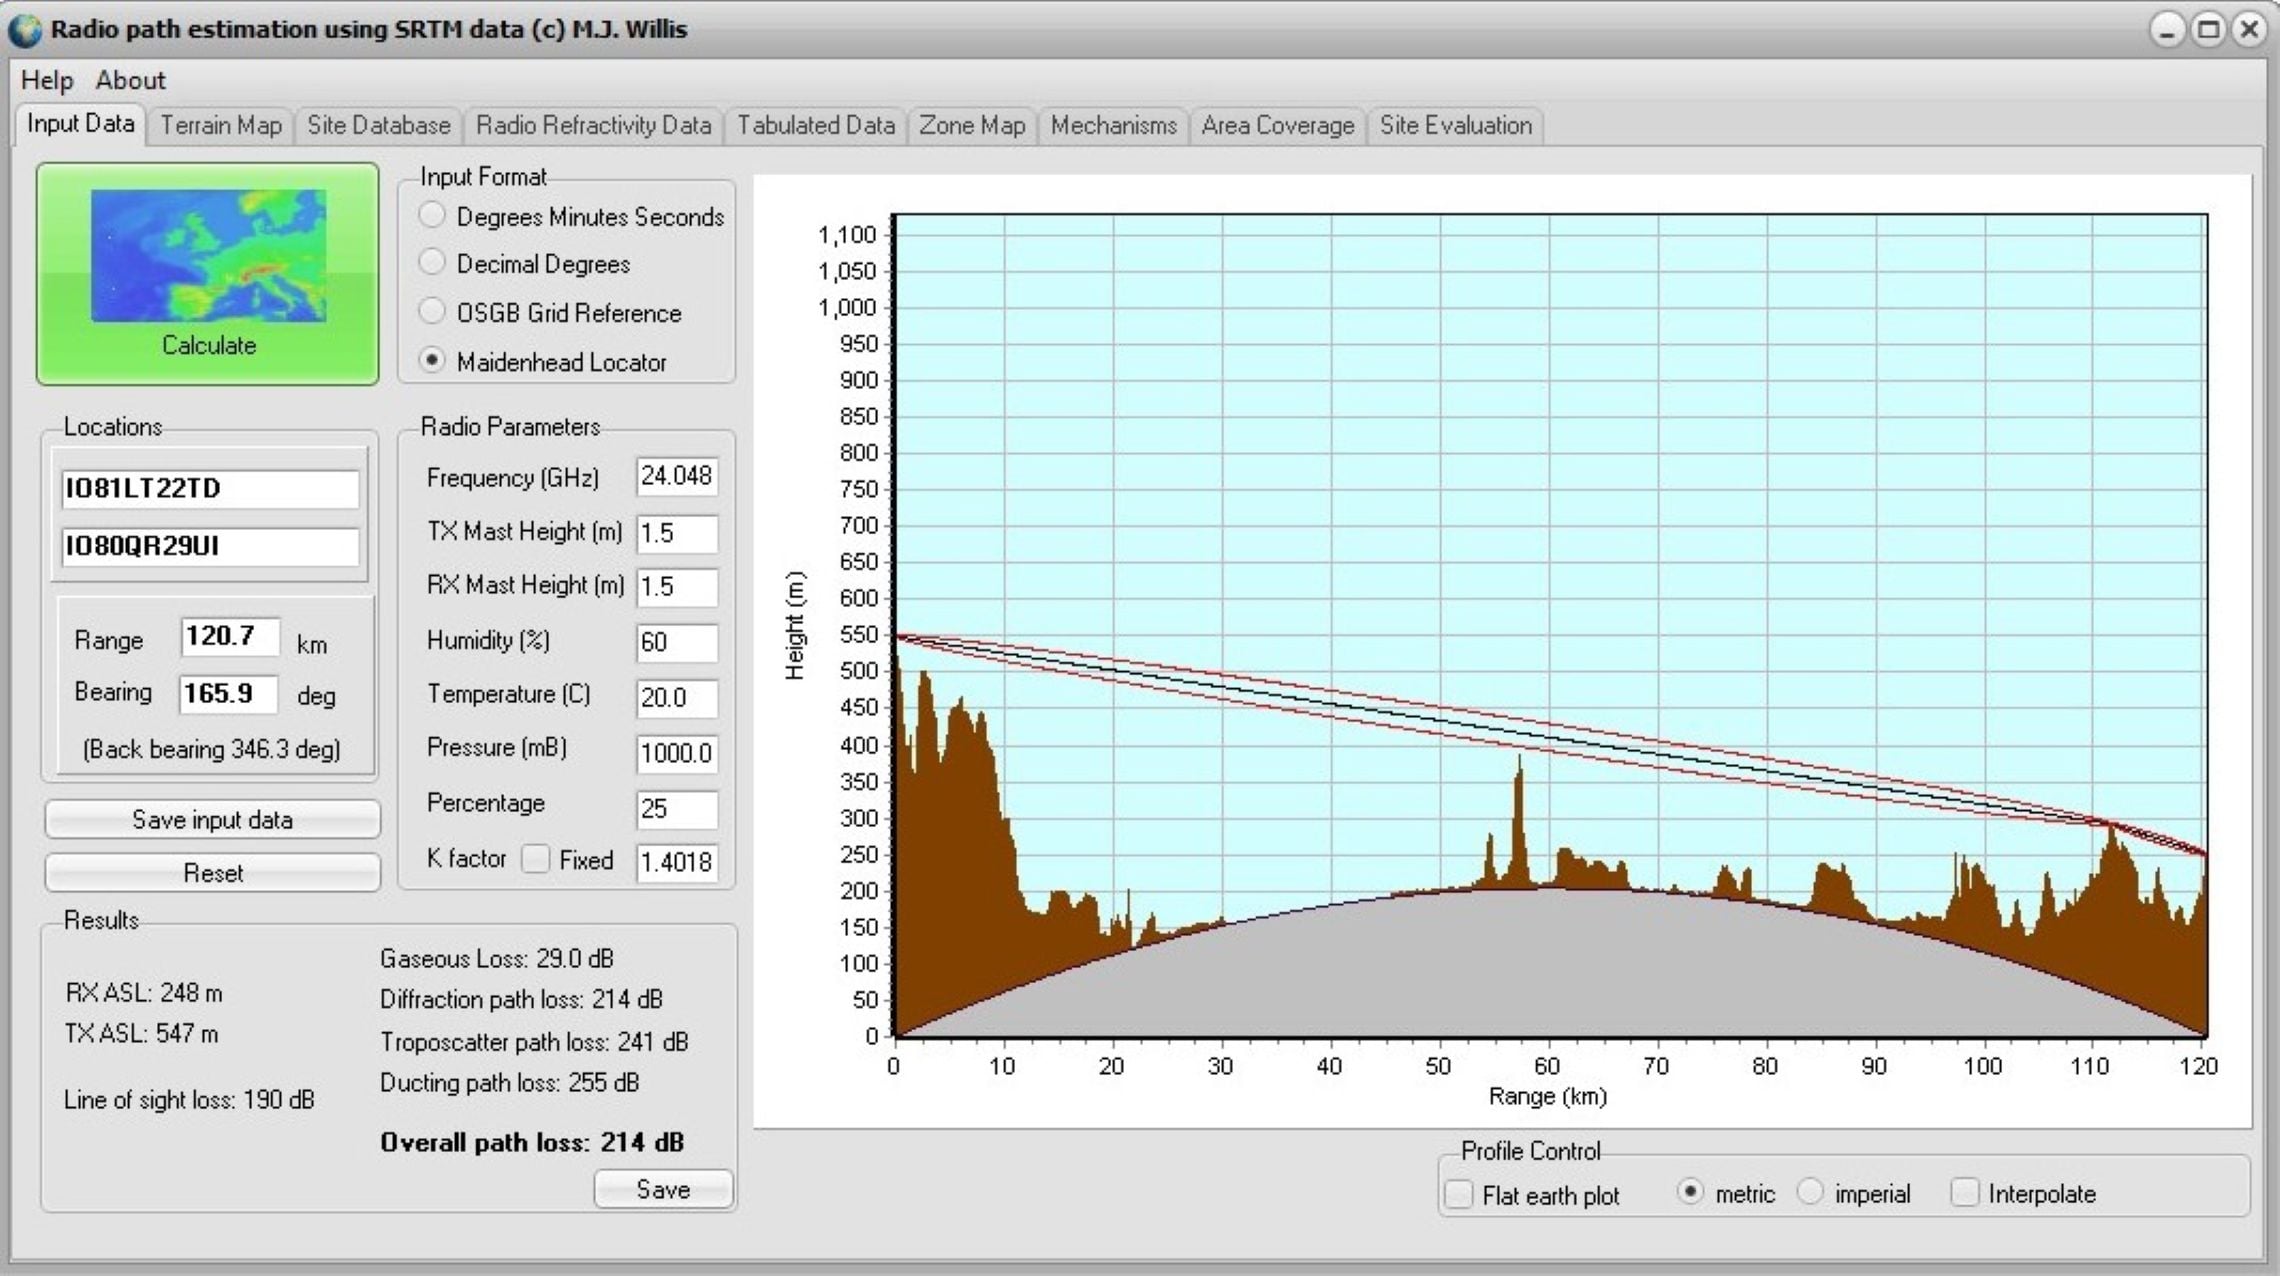
- You should now see a terrain plot with earth curvature applied
Locator Accuracy Matters
To get the best results, use 10‑digit locators. Shorter locators introduce significant positional error:
- 6‑digit locator (e.g., IO82WB) Square size: ~30–35 km² Positional error: ±5 km → You may not be plotting the hilltop you intended!
- 8‑digit locator Positional error: ±2–3 km
- 10‑digit locator Positional error: ±1–1.5 km → This is the best choice for microwave path profiling.
Understanding the Input Fields
When you first open the SRTM Path Profile software, the number of boxes and parameters can look a little intimidating. This section explains what each field means, what you should enter, and how each value affects your final path calculation to your QSO partner.
Location Inputs
You can enter your location and your QSO partners’ location coordinates in several formats:
- Decimal Degrees
- Degrees Minutes Seconds
- OSGB Grid Reference
- Maidenhead Locator (which is how most of us use this software)
The software converts everything internally to latitude/longitude.
Range and Bearing
Calculated automatically once both locations are entered and you click Calculate
- Range: distance between TX and RX
- Bearing: direction from TX to RX
- Back‑bearing also shown for your partner if required
Radio Parameters
- Frequency (GHz) – Affects free‑space loss, atmospheric absorption, diffraction, and troposcatter
- TX/RX Mast Height (m) – Height above ground level. Crucial for Fresnel zone clearance and avoiding local clutter
- Humidity (%) – Higher humidity increases gaseous absorption, especially above 10 GHz
- Temperature (°C) – Affects refractivity and atmospheric loss
- Pressure (mB) – Standard pressure is ~1013 mB. Lower pressure slightly reduces absorption
- Percentage (%) – Time percentage for which the prediction applies. I usually choose optimistic because we can accept some QSB!
- 50% → median
- 20–30% → optimistic
- 90% → worst‑case reliability
- K‑Factor – Defines effective Earth radius.
- Standard: 4/3
- Higher K → Earth appears flatter
- Lower K → Earth appears more curved
Results Section
- TX ASL / RX ASL – Altitude above sea level
- Line of Sight Loss – Free‑space path loss
- Gaseous Loss – Atmospheric absorption
- Diffraction Path Loss – Loss caused by terrain blocking the path
- Troposcatter Path Loss – Scatter loss for non‑LOS paths
- Ducting Path Loss – Loss assuming ducting conditions
- Overall Path Loss – The dominant propagation mechanism is selected automatically
Terrain Profile Graph
The Terrain Profile Graph shows us:
- Ground elevation
- Radio path line
- Earth curvature
- Fresnel zone clearance
This is the heart of the tool — it shows exactly where our path is obstructed. You can run your mouse along the path to see the range and height etc.
Typical Values For UK Microwaves
If you’re unsure what to enter, here are sensible defaults for typical UK hilltop microwave operation:
- Humidity: 60–80%
- Temperature: 10–20°C
- Pressure: 990–1020 mB
- K‑factor: 4/3
- Mast height: 1–3 m
- Percentage: 25%
- Locator: 10‑digits are recommended
What the Other Tabs Do
Although most people use the Input Data and Terrain Map tabs, the software includes several additional tools that can help you analyse a path more deeply.
Terrain Map
Shows the terrain tiles you’ve loaded.
Site Database
Store frequently used locations (hilltops, beacons, home QTH).
Radio Refractivity Data
Displays refractivity values used in the propagation model.
Tabulated Data
Numerical breakdown of the terrain profile.
Zone Map
Shows Fresnel zones and clearance along the path — extremely useful for microwavers.
Mechanisms
Displays calculated losses for LOS, diffraction, troposcatter, and ducting.
Area Coverage
Generates coverage maps from a single site.
Site Evaluation
Summarises how good a site is for radio work based on surrounding terrain.
Why Use SRTM Path Profiles?
For high band microwavers, terrain is everything. A path that looks clear on a map may have a hidden ridge blocking the Fresnel zone. This tool can help you visualise the terrain between two sites and easily spot obstructions. I use it regularly to evaluate sites around the Brecon Beacons and Black Mountains where I operate.
Mike Willis’s SRTM Path Profile software remains one of the simplest and most effective tools for generating terrain profiles using free SRTM data. With just a few tiles and a straightforward setup, you can analyse microwave paths anywhere in the UK with excellent accuracy. It’s lightweight, fast, and doesn’t require online access once the tiles are installed.