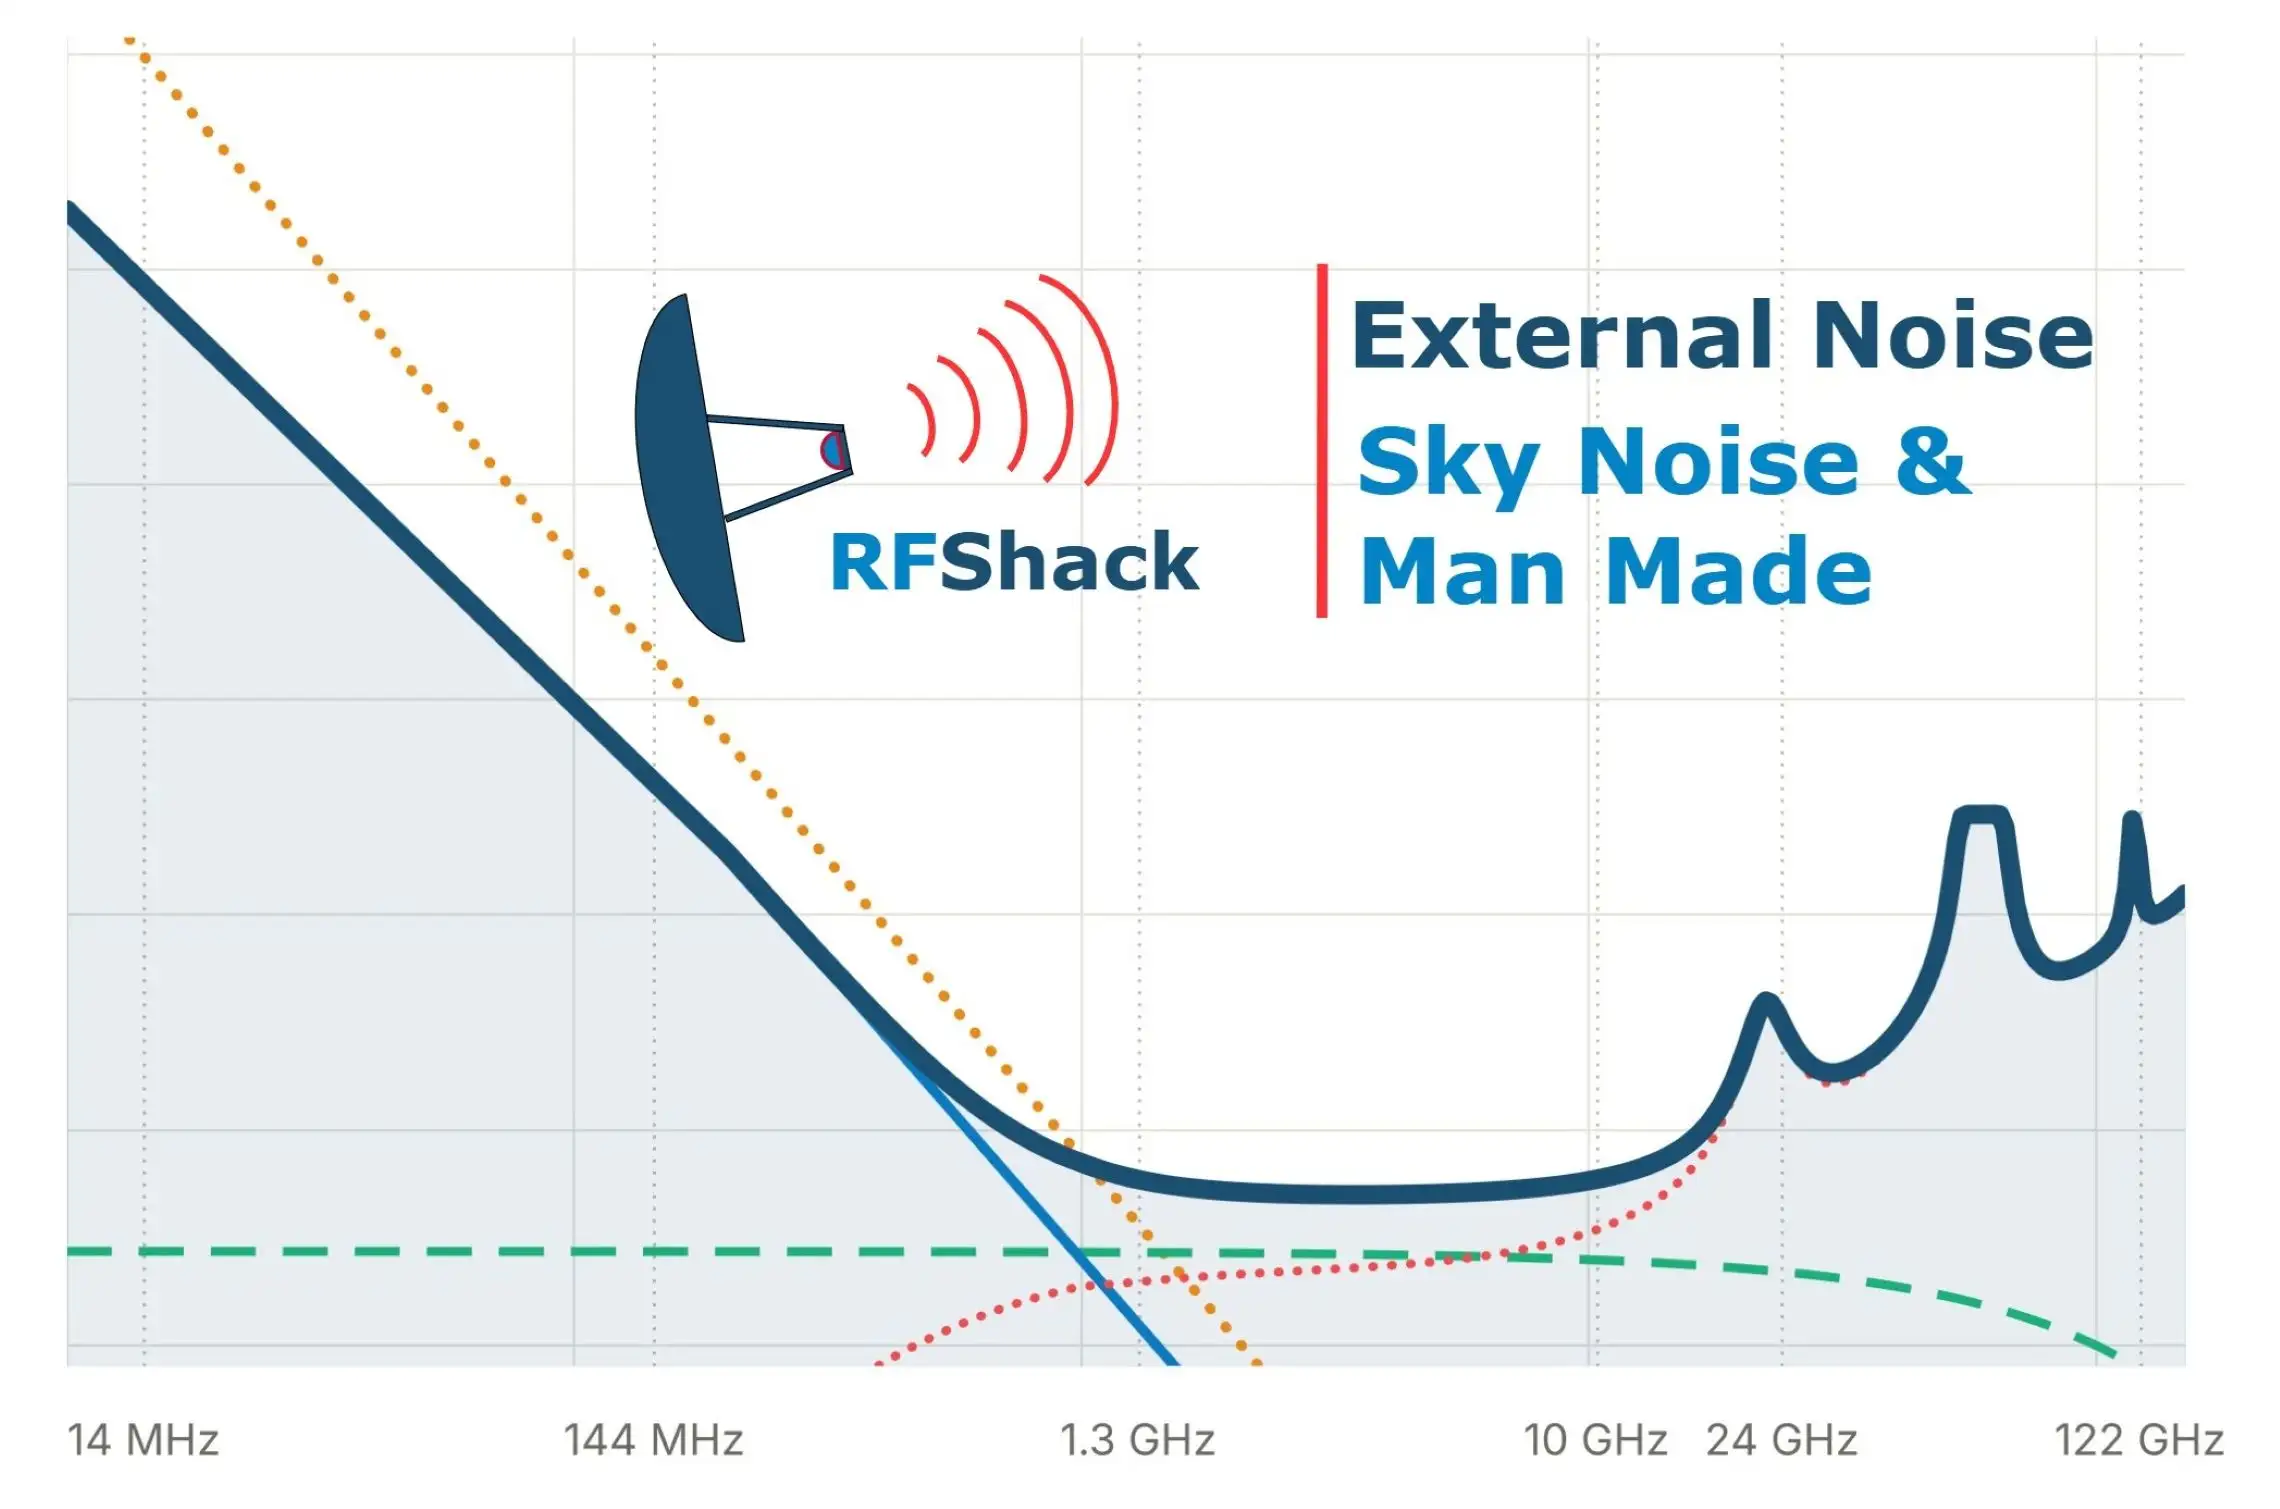
Receiver noise gets most of the attention because it is the part you can buy your way out of. But our antennas deliver noise too, and on many bands that noise is larger than anything the receiver adds.
The balance swings dramatically with frequency. On HF, local man-made noise sits orders of magnitude above any receiver. On 10 GHz, the sky is almost silent and the receiver is most of the problem. Knowing more about noise on your band of interest tells you where to spend money and effort.
Sky noise
Between about 1 and 10 GHz the sky is the quietest thing you will ever point an antenna at, around 5 to 6 K looking straight up, and it gets noisier on both sides. Four contributors shape that curve.
$$T_q = \frac{h f}{k}$$
The total sky temperature is the sum of these contributions in kelvin, not in dB. Below 1 GHz the galactic term dominates, above 10 GHz the atmosphere takes over, and the minimum sits in the gap between them.
Calculate sky noise temperature vs frequency, 10 MHz to 150 GHz
Try the elevation slider and the temperature and humidity inputs, and the man-made noise tick box, to see how each contribution changes.
Elevation, humidity and band
Tilting the dish changes only the atmospheric part of sky noise, but at the upper microwave bands that part is large.
The path through the atmosphere is roughly 1/sin(elevation) times longer than straight up: about 2 times at 30°, 5.7 times at 10° and 11 times at 5°. The CMB and galactic terms stay put; the atmospheric term is multiplied. At 10 GHz the atmosphere adds around 3 K at the zenith, so at 10° elevation it adds about 19 K. At 24 GHz it adds roughly 29 K at the zenith and about 130 K at 10°.
Notes:
Humidity matters from about 10 GHz upward. Water vapour has a resonance at 22 GHz, which is why 24 GHz is the first band where a muggy day is clearly noisier than a dry one: cold, dry winter air (0 °C, 40%) gives about 10 K of atmospheric noise at the zenith, against about 30 K at 20 °C and 60% and nearly 70 K on a hot, humid day (30 °C, 80%).
The effect does not stop at 24 GHz. At 76 GHz water vapour absorbs even more than at 24 GHz, but oxygen supplies about half of the total there and about three quarters at 47 GHz, so humidity moves a smaller fraction of the total. Cloud and rain push the figure much higher still: as rain attenuation grows, the sky behind it starts to look like a warm absorber at the temperature of the rain, so you lose signal and gain noise at the same time!
This is why the same 24 GHz station can measure noticeably different sun noise or cold-sky figures from one day to the next. Use the chart above to read off the figure for your own elevation, temperature and humidity before you compare it with a measurement.
Man-made noise and the ITU-R P.372 model
Below about 250 MHz, noise made by people usually beats the sky, and ITU-R Recommendation P.372 gives the standard way to estimate it.
$$T_a = 290 \times 10^{\,(c - d \log_{10} f)/10} \ \text{K}$$
P.372 expresses external noise as a figure in dB above thermal noise at 290 K, measured at a short, lossless vertical monopole. For man-made noise the median value follows a straight line against log frequency, where f is in MHz and c and d are constants for each environment, explained below.
Here c and d are the two constants of a straight line fitted to the survey data. c is where the line starts: the noise level in dB above thermal noise that the line gives at 1 MHz, where log f = 0. It sets how noisy the environment is overall, so a city has a higher c than a quiet rural site. It is a fitted figure, not a measurement, because P.372 only covers 0.3 to 250 MHz. d is the slope: how many dB the noise falls for every tenfold increase in frequency. All four man-made environments have a d of about 28, so noise drops by about 28 dB per decade, or about 8 dB per octave.
For a city at 144 MHz, log₁₀ 144 = 2.16, so Fam = 76.8 − 27.7 × 2.16 = 17 dB. That is the 17 dB in the table, which is a noise temperature of 290 × 10^1.7 ≈ 14,500 K.
Two things stand out. First, every environment falls by roughly 28 dB per decade of frequency, about 8 dB per octave, so man-made noise melts away as you climb. Second, the quiet rural figure at 144 MHz is below the galactic line. The values are in dB above the noise of a 290 K resistor, so a negative figure is simply less than 290 K: −8 dB is about 46 K, against about 460 K for galactic noise at +2 dB. The two add in kelvin, not in dB, so the sky dominates. On paper, a receiver there is limited by the sky, not by the neighbours.
In practice, the situation is different because these recommendations were produced from measurements taken in the 1960's and early 70's. It predates solar inverters, switch-mode supplies, LED lighting and powerline adapters often lifts the HF and VHF noise floor well above these quiet figures, even in rural areas, so measure your own site before assuming you are sky-limited.
To put the HF numbers in context, 45 dB in a city at 14 MHz means the antenna is delivering around 30,000 times the noise power of a 290 K resistor. A receiver with a 0.5 dB noise figure and one with 5 dB are indistinguishable.
The sky noise chart can overlay these curves. Tick Man-made noise and choose an environment, and the man-made level is added to the total and to the band readouts. P.372 is stated for up to 250 MHz, so the chart shows the part above that as a dotted extrapolation.
Three caveats before you rely on the curves:
How To Measure Noise At Your Site
You can find your own noise level with any receiver whose gain you can hold fixed.
1. Switch AGC off and fix the gain. Pick a clear spot in the band and a narrow, known bandwidth, such as 2.4 kHz.
2. Replace the antenna with a 50 Ω termination in its place, (directly at the receiver input). Note the noise level in your SDR software's signal level meter or spectrum display, averaged over several seconds. Meters often average in dB, which reads about 2.5 dB low on noise, but because you are measuring a ratio this largely cancels, as long as you average both readings in the same way.
3. Reconnect the antenna with its normal cable and note the noise level again, with the same settings and averaging.
4. Y is the antenna noise power divided by the load noise power, as a ratio (10 to the power of the dB difference divided by 10).
5. Antenna noise temperature is:
$$T_a = 290\,(Y F - F + 1)\ \text{K}$$
where F is the receiver's noise factor. If the receiver is much quieter than the noise, Ta is about 290 × Y.
6. To compare with P.372, convert to:
$$F_a = 10 \log_{10}\!\left(\frac{T_a}{290}\right)\ \text{dB}$$
Site Noise Calculator
Add 10 dB of attenuation as a check. The noise should fall by exactly 10 dB. If it falls by less, a signal or the receiver's own noise is skewing the result. Correct for feedline loss and antenna efficiency or you will read too low. (Antenna efficiency is negligible for efficient antennas such as yagis and dishes. It can be several dB or more for electrically small antennas such as short HF verticals, loops and compact portable antennas). Repeat at different times of day, in wet and dry weather, and with the house power off, as solar inverters and chargers change a lot.
If you have a masthead LNA, put the termination at the LNA input, in place of the antenna, and use the noise figure of the whole chain as seen from that point: the LNA, the cable and the receiver combined. The calculator below has a masthead LNA mode that works this out for you. You cannot measure the antenna by connecting the termination at the shack end of the cable.
On the microwave bands the same idea becomes a Y-factor measurement, comparing the receiver’s noise on cold sky with a hot load or the sun. The Sun, Moon and Cold Sky article walks through it (coming soon...).
Finding and cutting local noise
On the lower bands, the cheapest improvement in your station is usually to remove a noise source, not to upgrade the receiver.
Finding the source
Usual suspects
Switch-mode power supplies and chargers, LED lamps and their drivers, powerline ethernet adapters, solar inverters, VDSL and ethernet cabling. Check the cheap, unbranded items first.
Cures
Above a few GHz the problem changes character. Broadband man-made noise has faded far below the sky, and the trouble is in-band interference from emitters such as Wi-Fi at 2.4 and 5.7 GHz, radar, and 24 GHz motion and automotive sensors.
Where external noise stops mattering
The test is simple: compare the antenna's noise temperature with the receiver's. If the antenna noise is much larger, a better receiver gains almost nothing.
Two worked cases make the point. At 144 MHz in a rural location, the external noise is about 1,600 K. A receiver with a 1 dB noise figure adds about 75 K, which costs roughly 0.2 dB of signal to noise ratio compared with a perfect receiver. At 10 GHz, the sky is about 6 K and an LNA with a 0.6 dB noise figure adds about 43 K, costing roughly 9 dB. At 10 GHz every tenth of a dB in the receive chain counts. At 24 GHz the same logic applies, and 24GHz Noise Figure: How Much Does an LNA Really Help on Tropo? works through what a better LNA buys you on a low-elevation tropo path. That is the subject of the next article in this series, on cascades and system noise.